Australian Road Fatalities in Context
/Driving is often the most dangerous thing you'll do all day, but how far has Australia come in making our roads safer?
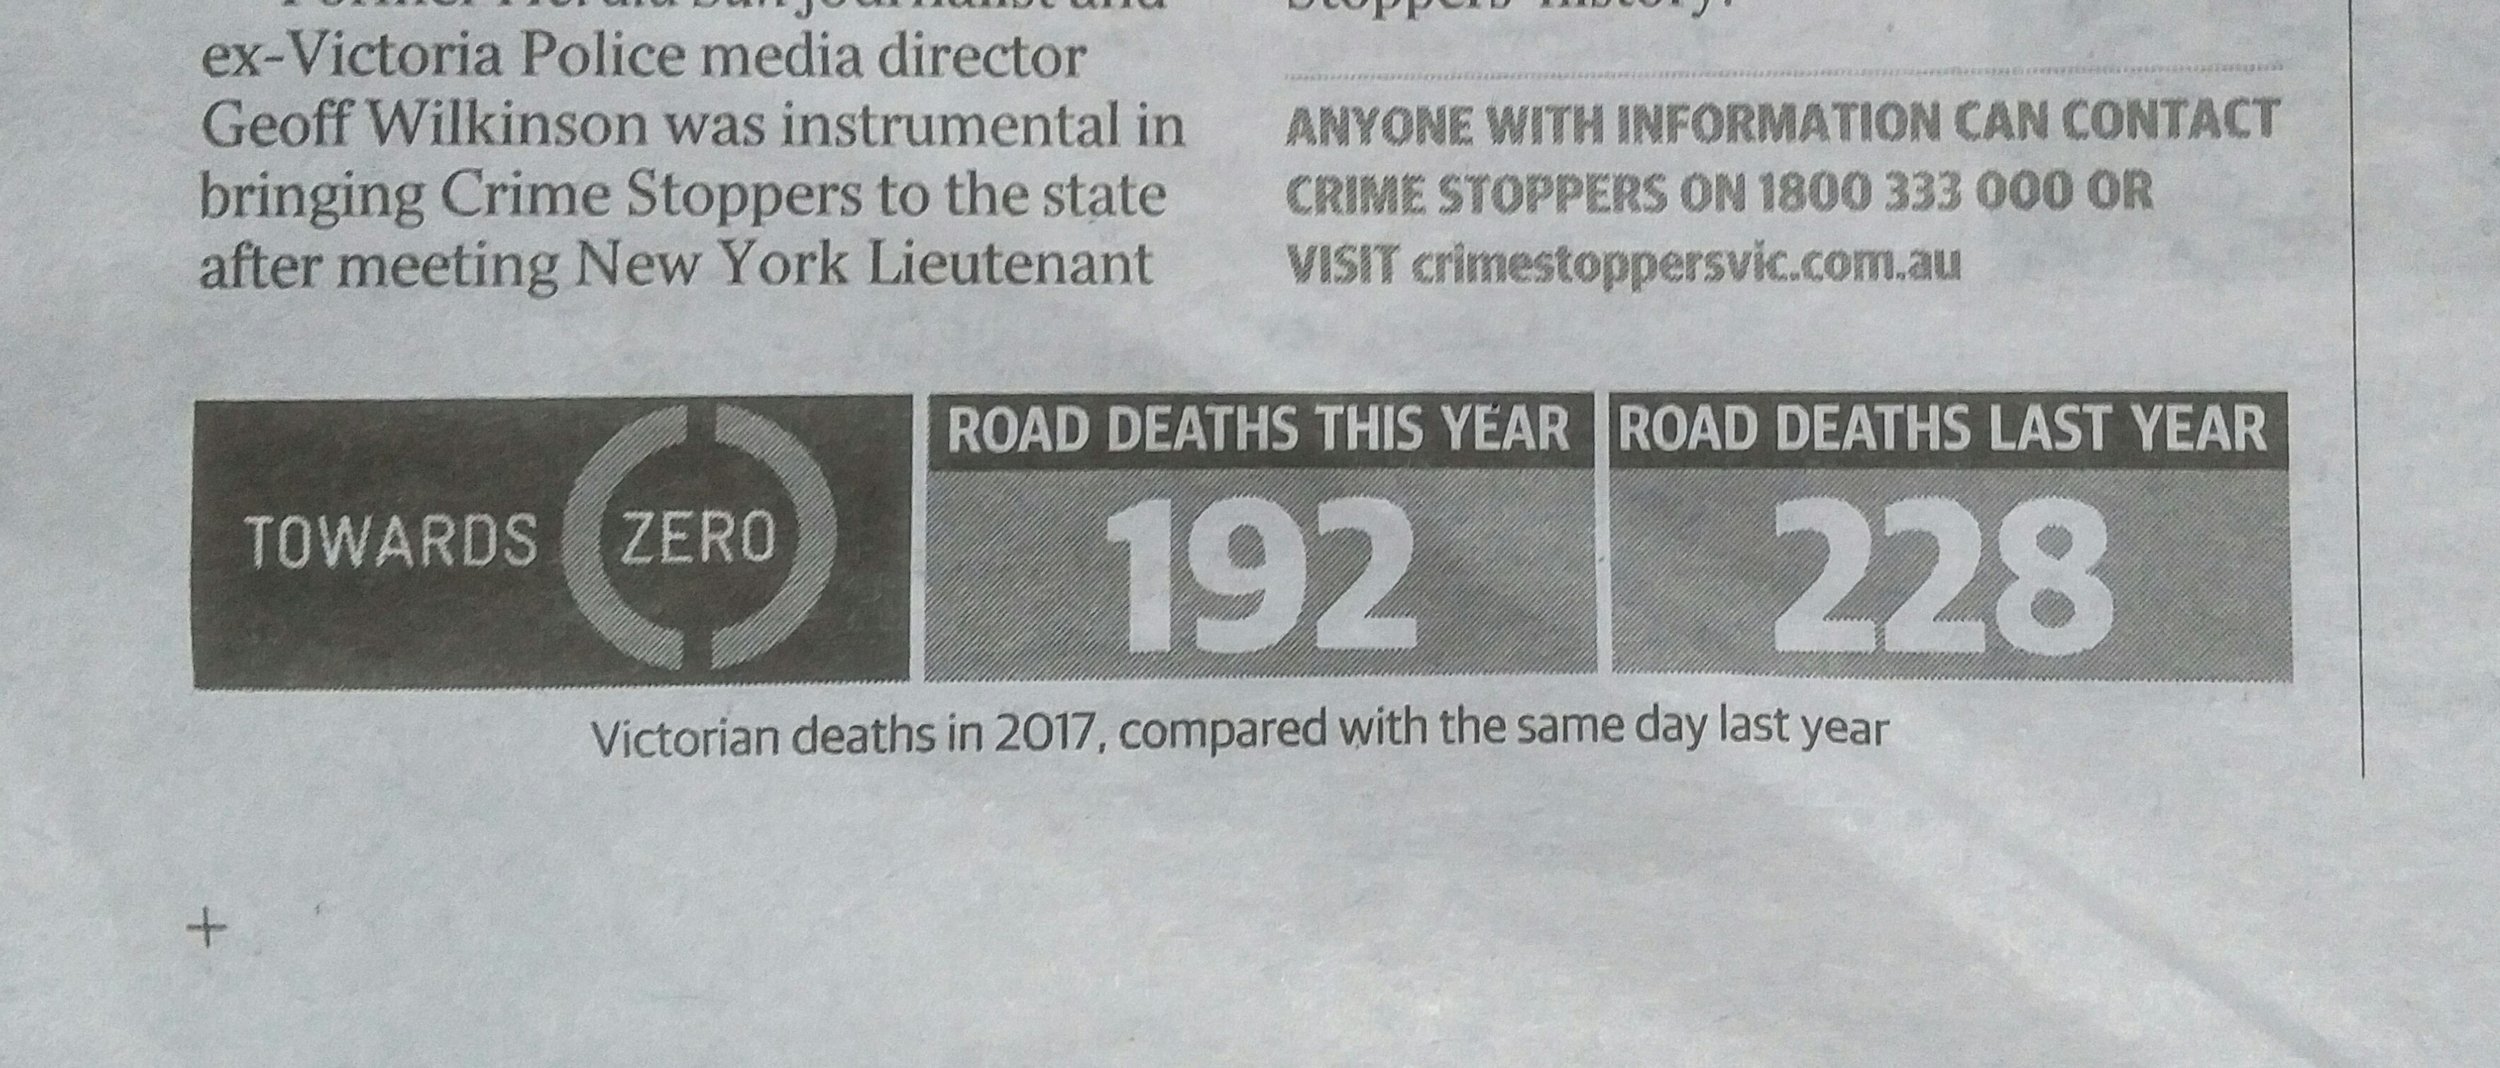
The media always spruiks the road safety angle. The Herald Sun publishes a running tally of deaths on Victorian roads in their newspaper every day. There are stories of spikes in fatal car crashes on public holidays and some states double the penalties for traffic fines during those periods.
Herald Sun, Wednesday 18 October 2017
Simply showing a death toll comparison from year to year doesn't show the full picture. There are historic trends that are lost when looking at two very specific pieces of data.
Australia wide, there were 3798 deaths in 1970 compared with 1209 in 2015. When visualised, we can see there is a dramatic reduction in the death toll in the past 45 years.
Looking at the death toll in proportion, we see an even bigger drop. Australia's population has grown significantly since 1970, so it must be considered. Looking at road deaths per 100,000 people in Australia, we see a steadier drop.
Taking into account population, there is a far smoother line and fewer outliers. Furthermore, if we look at both graphs side by side, using fatalities in 1970 as a base point, we can see that road deaths in proportion to population has reduced further than the death toll alone shows.
So the next time you see the road deaths published in the Herald Sun each day, remember there's more to those numbers than meets the eye.


